
THE CORE OF SCOREUS
IS CONSIST OF THREE DIFFERENTMANAGEMENT TOOLS
The ScoreUs system is designed through robust management tools to provide timely performance information as well as detailed insights into current orders, which allows users to make informed procurement decisions quickly and easily. This system is essential for improving efficiency and reducing waste.
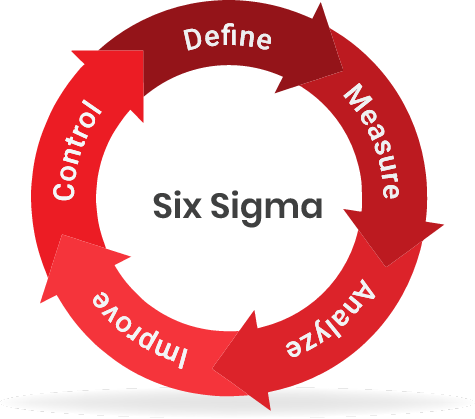
Six Sigma (DMAIC)
Definition:
Of course, we always want to know how our vendors are doing, and we try to have a fair mechanism to evaluate vendors, but how to get started is the question. If we want how vendors perform, we must first understand how we want to evaluate vendor’s performance, so the first step we need is to define an evaluation matrix to let vendors understand our needs. In the ScoreUs app, we focus on the four most important aspects - on-time delivery, product quality, price variance and Lead Time accuracy
On-Time Delivery:
Whether the delivery date promised by the vendor for the first time after the order is placed is executed on time. This delivery date of the first promise has a great impact on our production schedule and the accuracy of delivery time to the customer.
Non- Conforming:
The non-conforming problem caused by the high defective rate of purchased goods is not only delaying delivery but also a very significant impact on the company’s reputation
Price Variance:
The price variance is in the balance between buyers and vendors. Too high is unfavarable for the buyer, too low is not friendly to the vendor, and whether the price variance is reasonable or not is also very important for the performance of the measured objectives.
Lead Time Accuracy:
The accuracy of the Lead Time is very important for when to place an order. Inaccurate lead time can cause orders to be placed too early or too late, resulting in out-of-stock or stock-up problems.
Measure:
What we measure determines what we can see and what we can improve.
What we need to care about necessarily determines what we need to measure, which in turn determines what results we will see. We care about on-time delivery, we measure on-time delivery, and then the stakeholder will invest more resources to meet our requirements for on-time delivery. If we focus on product quality and measure it, stakeholders will focus on quality and know that quality control is important to us. If price variance is important to us, stakeholders will make it as a first priority. If lead time accuracy is important, stakeholders will spend more resources on improving their accuracy.
As a procurement expert with many years of experience. We believe that the management of procurement must be controlled from at least four different indicators – on-time delivery, non-conforming, price variance and production lead time accuracy.
In this ScoreUs Procurement Management application, we use simple but very efficient calculations to measure, monitor and review procurement data with tens of thousands of orders and defective products, and create a simple and user-friendly visual interface, so that end users understand how to measure and manage the procurement process, and obtain meaningful information, so as to continuously improve the user’s overall procurement management performance.
Analyze:
Once we have decided what to measure and the weights needed for each measurement, we need to know how to proceed with the analysis. This is the most critical step and a common difficulty for most companies in the six sigma process. Most companies spend a lot of money hiring professional analysts or specialized functions to review and analyze this meaningful information so they can find what the problem is.
This process is time-consuming and expensive, and in most cases, the information is not clear and meaningful due to the lack of effective analysis way, and there are often long waits for reports, and the best timing for improvement is often past. After all, very few people really understand and know what their next move should be. This will lead to increased confusion and uncertainty in procurement management, and cause more new difficulties in procurement management.
Through this ScoreUs management application, you can get on-time delivery percentage, non-conforming percentage, Price variance percentage and production lead time accuracy percentage based on the different parameter setting in the system, with individual score, total average score, total target score and line chart analysis report. How many bad scores need improvement in the red area and how many are performing well in the green area? Different
analysis results enable you to grasp procurement performance information in real time and clearly inform your future procurement strategy.
This ScoreUs management application not only provides data measurement and analysis of individual vendors and buyers, but also obtains scores for different commodities, materials and factories under your jurisdiction, so that you have better control over all procurement management of the entire company.
Improve:
Once we have useful performance analysis data, line graphs, red and green areas, percentages, scores and average scores, the next step is to improve this data and track the results. This step is the most difficult for most companies. This ScoreUs management app can help your future right direction.
You can start talking to vendors, buyers and plant managers. At this point, you can begin to display and compare their performance data with the average score and target score, set mutually agreed-upon target performance score, and communicate and plan how to achieve the goals. Once the goal is set, we may meet again in a month, three months, or half a year to review.
You will review your ScoreUs management app when you meet again to re-evaluate the latest performance score together. If there are improvements, we will continue. If there is no improvement, we will discuss a different approach and leave it to the next meeting until we finally see improvement.
For a specific item, a specific product, a specific factory, a specific vendor, or a specific buyer, you can talk to them with the right information and data and really know what target to improve.
Control:
You can now completely manage and control procurement through quarterly business reviews for vendors, monthly or semi-annual performance reviews for purchasing departments, and factory evaluation reviews. Procurement performance is automatically controlled by letting each assessee know their current score, whether their target score is up to scratch, cross-comparing with others’ average scores, and then encouraging each other to seek improvement. The manager’s job will become very easy. Vendors, buyers and factories know their performance scores and they know they are in the red zone or the green zone.
No one wants to be part of the red zone or what other people talk about. They will work to improve spontaneously because they know they are behind. They feel embarrassed and want to find ways to improve themselves and solve problems because they know there is real data behind to compare against. Through this continuous virtuous circle of comparisons, all scores will continue to improve, eventually reaching the goals required by management.
This ScoreUs management application will continuously monitor and improve performance. Vendors, buyers, managers and commodity managers work together to maintain the good performance. Once they see their scores drop at weekly/monthly/quarterly reviews, they can react and take immediate action to keep their scores at the required level. Now you’ll see that everything is under control and it is easier to manage and control procurement performance.
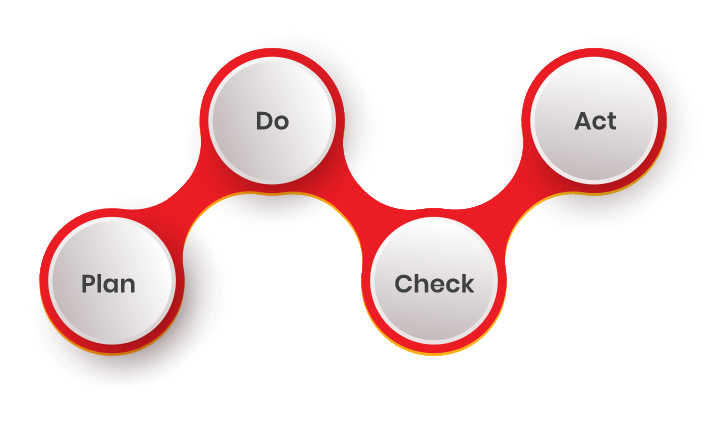
Continuous Improvement
Plan:
ScoreUs is a tool that utilizes a variety of management approaches to help you manage your procurement. One of them is continuous improvement. Before you start managing procurement, you need to plan what you want to see from your approach?
Is on-time delivery, price more important, or not meeting production schedule is more important to you, what else is important? You need to think what you really want to see, or what you should measure first. Once you have a plan for what you want to see and what you want to measure, the next steps will be relatively simple.
For example, on time delivery may be more important to you than price, because line downtime due to material shortages is more serious than money saved from price. In this case, you should focus more on the on time delivery than saving the price. Does early delivery cause any problems for you? Or, do you welcome early delivery because if there is no option you want to get it sooner rather than later. In this case, you need to waive the penalty for early delivery of materials and focus only on late delivery. Your product usually does not have product quality issues, so you probably shouldn’t overweigh product quality issues when planning to measure.
Total cost is something you should always keep in mind. ScoreUs considers the four most important indicators for a good procurement process and allows you to weigh which indicators are more or less important to you so you can carefully plan how your procurement activities will be measured. Defining what you care about (past), what you want to manage (now) and what you want to improve (future) is the key to successful procurement management.
When you start the procurement management process, Plan is the most important process. Garbage in garbage out. The wrong plan will lead you to wrong actions and future results.
Do:
Check:
Now everyone is heading the same direction because your metrics plan is so clear that it will encourage them to work towards the same goals. We know it will take time to reach the required goals, but we believe it won’t take that long.
It’s been a while since you first communicated with them and measured goals, so now they should have plenty of time to have done all the right things to achieve them. You should also have collected enough data by now to see the results of their current efforts. It is time to see some progress and sit back and share the results with your stakeholders.
You may have seen some good or bad performance, higher or lower scores. Because they are clearly visible in the ScoreUs system, you can compare them to the target scores you set for them and the average scores of others, and communicate with them how they are doing. You can point out the problem and communicate what the problem is and how it can be improved.
During this step, you will sit down with them at any time on a regular basis to discuss improvement strategies. It could happen in your daily workshop meeting, weekly group meeting or monthly factory meeting. Additionally, you can discuss monthly or quarterly scores with vendors, buyers or plant managers at quarterly or annual performance review meetings. Because you can easily and clearly see from the ScoreUs system how, where, when, what and who these issues are happening, your conversations will be more reliable and efficient.
Act:
So far, we have been continuously monitoring the performance scores of vendors, buyers, factories, commodities and materials. We should all have known the five W’s (when, how, why, who and what) of good scores and bad scores. Now it is the time to act. If the performance score is good, then keep the current direction, maintain it and make it better. If the performance score is bad, we should discuss how we can work together with stakeholders to improve the score and move it back in the right direction.
Don’t forget that we should also focus on the good scores we have achieved, looking back and remembering all the efforts we have made to maintain that good scores. By doing this way, we can not only do it better but also adopt those efforts to improve bad ones.
More strategies should focus on what you need to do to get a bad score back on track and improve it. The beauty of the ScoreUs system is that it provides a 360-degree view around your objectives (vendors, buyers, factories, commodities, and materials) and key performance indicators (on-time delivery, product quality, price variance, and lead-time accuracy). So that when you focus on one performance scores, you won’t miss any others. With ScoreUs, no one wastes time arguing and confusing. You can easily see your scores go up or down at any time and guide them in the right direction before it’s too late. No one wastes time arguing and bewildering.
Visual Management
Visual management is a very effective way for clearly communicating key information about expectations, performance, standards and warnings
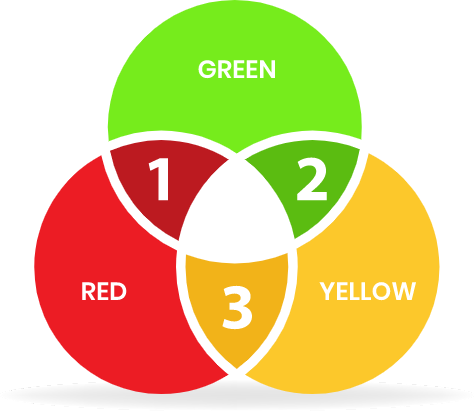
The most common visual management system is the traffic light system. RED means stop, YELLOW means warning, and GREEN means move. The most important thing in visual management is to convey information through visual objects, which can be colors, symbols or numbers, with very simple and
clear definitions. If training is required to understand what an object means to them, then this is not good visual management. We use the same traffic light system for ScoreUs users to easily know where to stop, where to continue, what’s good and what’s bad.
In the ScoreUs system, visual management is represented by three colors, RED, YELLOW, and GREEN , and three arrows up, down, and flat.
RED:
Indicates below-average overall performance – if performance is below-average overall, this indicates that performance should be assessed immediately and the priority is to remain “highly vigilant” to keep it under frequent review and to decide if immediate further action is required , how to bring it to the yellow or even green zone, or terminate the entity’s cooperation if necessary.
YELLOW:
Indicates that the performance is between the target total and the average total – if the performance is in between, the performance is not perfect, but acceptable. It will be the second priority and will be “sufficiently vigilant” to bring it under ordinary scrutiny. You will try to bring them into the green zone and keeping them above average is the next thing you can consider doing.
GREEN:
Means performance is above the overall target score – if the performance is above the overall target score, it means that overall on-time delivery, product quality, price variance and lead time accuracy are in good shape from all four perspectives. We should thank and encourage stakeholders to maintain their performance levels. In addition, we will begin communicating with the stakeholders to reasonably achieve a higher target overall score to achieve the company’s ultimate goal.
Up Arrow -
Indicates that performance has improved compared to performance in the past time frame, and the entity has taken some positive actions that have a positive impact on the score. You can also easily tell that you are improving in a good direction when you see an uptick in the line graph
Down Arrow -
Indicates that performance has not improved but has gotten worse compared to past time frame. You can easily judge that there may be worse performances in the future. The entity may have taken some good steps, but may have done poorly or incorrectly, negatively impacting the score. When you see a line chart going down, you need to actively communicate with that entity to see if you can help further.
Flat Arrows -
Indicates no improvement or improvement in performance compared to performance in the past time frame. The entity may or may not have done a good move, so it has an irrelevant effect on the score. When you see the line chart flatten, you can proactively communicate with the entity to see if it can help further.